Dive Into The Web Anti-Debugger — How Does It Work and How to Bypass
Recently, I was navigating the internet while developer tools were still open to inspect the site's content, but my dev tools stopped working at some point indefinitely. And my curiosity awakened. 👁️👄👁
Before we move forward, we need to understand what, why, and how to either create a version of your anti-debugger or bypass it.
What’s and Why Anti-Debugger?

Imagine that you have invested your time, money, blood, and tears into making code on your website for several months to make it work. Then, somehow, you see your code or your work appear on the other website after publishing it in a couple of days?
Anit-debugger helps protect your code from being stolen by others (note that not 100% protected, but it puts an extra layer of difficulty to make it harder to directly steal or copy).
Of course, anti-debugger is not the only way to protect your assets, but there are other patterns as well, which we’ll not focus on in this blog.
How: Let’s See The Anti-Debugger Code

Consider the code example below:
setInterval(() => {
  // simply this function is called `debugger` statement
  // if we're open the debugger tool it will be paused at this line
  // and we cannot perform any actions on their site.
  debugger;
}, 2000)
If you put the code in the Chrome Dev Tools or any available dev tools. Your dev tool will pause every 2 seconds, and you cannot exit from that until you close the dev tool. Why is that?
The debugger Statement
- The debugger statement triggers any available debugging feature—like pausing execution at a breakpoint. If no debugger is active, the statement does nothing.
The Enhanced Code: Big Brother is Watching You
In Linux, there is an executable called timeit . This program will measure the time it takes to execute the program.
What if we want to detect and do something, e.g., show a pop-up like this:

Give the example piece of code:
setInterval(() => {
  const past = new Date()
  debugger;
  const now = new Date()
  if (now - past >= 2000) {
    // debugger detected
    // ... do something, such as open a meme page or alert indefinitely
  }
}, 2000)
You can copy this code and open it in the dev tools, and it will execute, then your dev tool will pause.
What happened?
- setInterval → Execute the given function every 2 seconds
- past → we record the past time and will use it later
- debugger → The debugger statement triggers any available debugging feature—like pausing execution at a breakpoint. If no debugger is active, the statement does nothing.
- now → get the current time
- now-past ≥ 2000 → if we subtract the time from now to past, if it’s more than 2000ms it will do something inside the if statement
After its script has detected that we’re open to our dev tools. It will terminate sites or open an infinite pop-up to prevent us from accessing their source code.
How to Bypass This?
We learn the trick to protect, and it’s time to break them, and I really love this part. 😉
🥲 For beginners, there’s no way to pause the dev tools being paused, and you cannot do anything unless you close them.
😈 For intermediate, you could do this:
1. Bypass — Deactivate Breakpoints
These are the easiest steps to bypass:
- Open Chrome Dev Tools
- Focus on the open tabs
- Type Command + Shift + P
- Type Deactivate Breakpoints
- That is!
2. Bypass — Ignoring Lists
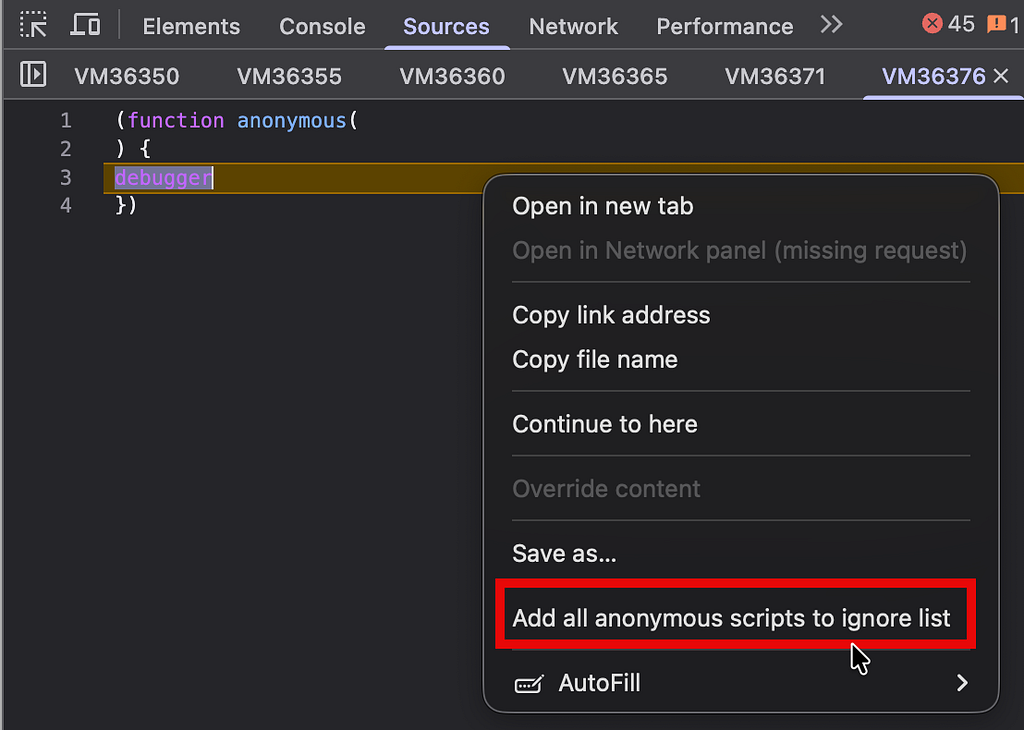
Right-click on the script you’re working on and
If you want to restore those, you could simply
- Open settings
- Ignore list
- Uncheck the “Enable Ignore Listing” Or Uncheck the “Anonymous scripts from eval or console”

Then go back to the dev tool and hit the play button, and your debugger will never stop at the debugger statement.
Conclusion:
Anti-debugger strategies are ways to not-leaked or let anyone reverse engineer for website. It helps protect our site from anyone who’s trying to tamper with the site.
Note that the run-time protection can’t protect our site from tamperers and can still be bypassed using this trick that I’ve mentioned in this blog. There are many tricks that you might have faced, which are:
- Code Obfuscation & Minification (Frontend-Level): most modern frontend framework does this automatically for us for “Minification”. Simply, terms are shortened to function and variable names to download faster.
- 👉 Runtime Protection (Anti-Debugging & Tamper Detection): This is what this blog is all about. They run some function indefinitely to detect whether the user is trying to tamper site or not.
- Move sensitive Logic To the Backend: simply and straightforward, forward like you order some food, and the chef cooks food behind the kitchen and serves you. You’ll never see the steps unless it’s completed food
- WebAssembly (WASM) → write the sensitive algorithm in another programming languages like C, C++, or Rust, then compile the core logic to the WASM module and run it in a browser
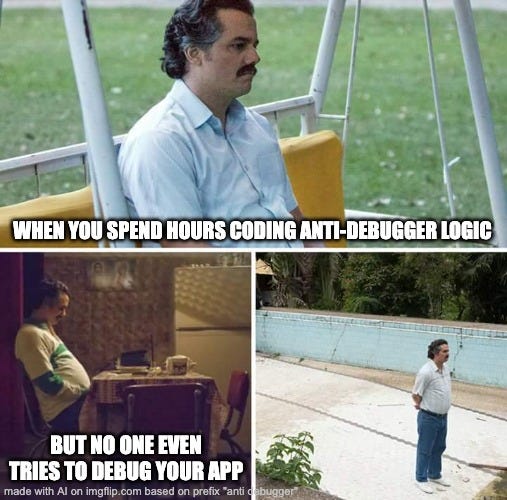
This is not typical content that I often write about, but I do love exploring these weird things or anything that awakens my curiosity, and the anti-debugger technique does. That’s why this blog happened 😃.
Hope you enjoy the experiment with me. Previously, I wrote an article on this topic. There is another blog post below:
How Did I Get TradingView Premium Plan For Free
References:
- https://developer.mozilla.org/en-US/docs/Web/JavaScript/Reference/Statements/debugger
- https://calib.io/pages/camera-calibration-pattern-generator
Dive Into The Web Anti-Debugger — How Does It Work and How to Bypass was originally published in Ayuth’s Story on Medium, where people are continuing the conversation by highlighting and responding to this story.